Back to Blog
Weekly KPIs for a $10k/Month Service Business: What to Measure and How in 2026
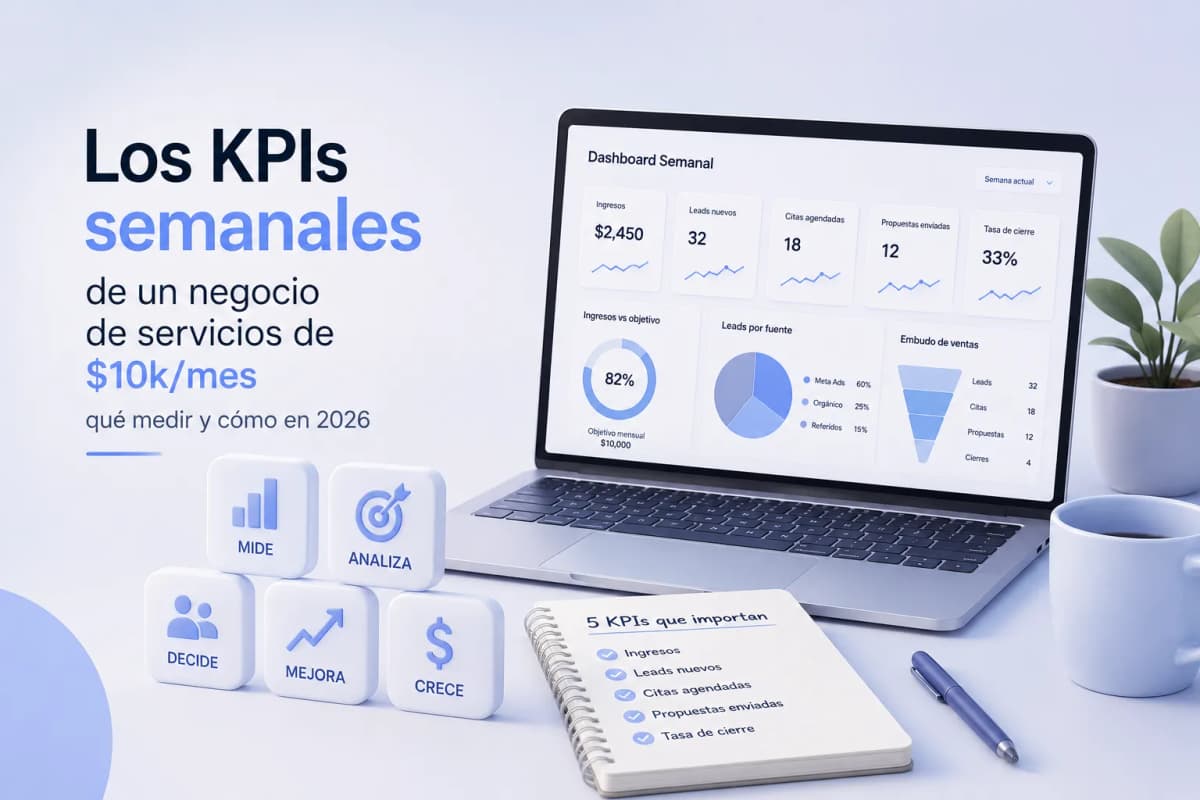
Most service business owners measure what feels important — followers, likes, reach. None of those pay the bills. If you can't answer in 60 seconds how much you earned this week, how many leads came in, and how many proposals are currently open, you're operating blind. The good news is that measuring correctly doesn't require expensive software — it requires 5 numbers, a Google Sheet, and 30 minutes per week.
The 5 Weekly KPIs That Matter (and Nothing Else)
|
# |
KPI |
What it measures |
Warning signal |
|---|---|---|---|
|
1 |
Weekly revenue vs. target |
Whether the business is on track for the month |
More than 2 consecutive weeks below target |
|
2 |
New leads (volume + source) |
Demand volume and which channel generates it |
Sustained drop or over-dependence on one source |
|
3 |
Calls or appointments scheduled |
Whether leads are advancing through the process |
Low lead-to-appointment ratio = problem with first contact |
|
4 |
Proposals sent and close rate |
Sales process effectiveness |
Close rate below 20% = problem with the proposal or pricing |
|
5 |
Active clients vs. target |
Business base health and retention |
If it drops week over week, there's an active churn problem |
Why only 5: each additional metric divides attention. A 20-KPI dashboard gets reviewed once and abandoned. A 5-KPI dashboard gets updated every week because it's fast and every number has a clear owner.
Monthly KPIs That Complement the Weekly View
Weekly KPIs tell you if this week was good. Monthly KPIs tell you if the business is healthy:
|
Monthly KPI |
Formula |
Healthy benchmark |
|---|---|---|
|
CAC (Customer Acquisition Cost) |
Total marketing + sales spend ÷ New clients that month |
Less than 20-25% of LTV |
|
LTV (Customer Lifetime Value) |
Average revenue per client × Average contract duration |
Minimum 3x CAC |
|
Net margin |
(Total revenue − Total costs) ÷ Total revenue |
30-50% for service businesses without full-time staff |
|
Monthly retention rate |
Clients retained this month ÷ Clients from prior month |
>85% indicates a stable business |
The ratio that matters most: LTV ÷ CAC. If acquiring a client costs $500 and that client generates $1,500 over their lifecycle, you have a 3x ratio — the minimum viable threshold. With a ratio below 2x, each new client you acquire gradually erodes the business.
How to Build the Google Sheets Dashboard in 1 Hour
You don't need BI software or an expensive CRM. A properly structured spreadsheet is sufficient for the first $20,000–$30,000 per month.
Tab 1: Weekly Dashboard
Create a sheet with these columns, one row per week:
|
Column |
Name |
Formula / Input |
|---|---|---|
|
A |
Week |
e.g. "Jul 14 – Jul 20" (manual text) |
|
B |
Revenue |
Manual: sum of payments received that week |
|
C |
Weekly target |
Fixed: monthly target ÷ 4 |
|
D |
% vs. target |
=B/C → format as percentage |
|
E |
New leads |
Manual: total leads that came in |
|
F |
Primary source |
Text: "Meta Ads / Referrals / Organic" |
|
G |
Appointments scheduled |
Manual |
|
H |
Proposals sent |
Manual |
|
I |
Proposals closed |
Manual |
|
J |
Close rate |
=IFERROR(I/H, 0) → format as percentage |
|
K |
Active clients |
Manual: total clients currently active |
Tab 2: Monthly Summary
|
Column |
Name |
Formula |
|---|---|---|
|
A |
Month |
Text |
|
B |
Total revenue |
=SUMIF(Tab1!A:A, "Jul*", Tab1!B:B) |
|
C |
New clients |
Manual |
|
D |
CAC |
Total marketing spend for month ÷ C |
|
E |
Net margin |
=(Revenue − Total costs) / Revenue |
|
F |
Clients at end of month |
Manual |
|
G |
Retention rate |
=F / F[prior month] |
How to activate it
- Create a new Google Sheets file
- Add the two tabs with the columns above
- Set the weekly target in column C (fixed for the whole month)
- Update the manual data every Monday in 10-15 minutes
- All calculated columns update automatically
The 30-Minute Weekly Meeting: Numbers That Become Decisions
A dashboard that gets reviewed but generates no decisions is decoration. The weekly meeting converts numbers into action:
Agenda (30 minutes, ideally Monday or Tuesday):
Block 1 — Review the previous week (10 min)
- Did we hit the revenue target? If not, how large was the gap?
- How many leads came in and from which source?
- How many appointments were held and how many proposals were sent?
- How many closes happened?
Block 2 — Identify the bottleneck (10 min)
There is exactly one main problem this week. Not ten — one. The bottleneck in a service business is almost always in one of three places:
- Insufficient leads → the problem is acquisition (channel, offer, ad budget)
- Few appointments from leads that come in → the problem is first response or qualification
- Low proposal close rate → the problem is the proposal, the pricing, or the follow-up process
Identify which of the three is the real problem this week and name only that one.
Block 3 — Decide one action (10 min)
One single concrete action to address the bottleneck. Not a list — one decision:
- "This week we're going to test a new hook on the Facebook ad"
- "I'm going to follow up on the 5 open proposals before Wednesday"
- "We're going to record a response video for leads who don't reply to the first message"
Why Not to Measure Followers, Likes, or Reach
Followers and likes are distribution metrics, not business metrics. They measure how many people saw or interacted with content — not how many bought, how much they paid, or whether the business can cover its expenses next month.
The problem with vanity metrics isn't just that they distract — it's that they create an illusion of progress that can delay important decisions. A business can have 50,000 followers and $2,000 per month in revenue, while another has 800 followers and $18,000 per month. The difference is in what they measure and what they optimize.
The only social media metric that belongs in a business dashboard is leads generated by source — which includes social media as one of the possible channels. That measures real impact, not popularity.
The Number That Best Predicts Future Growth: the 30-Day Pipeline
This week's revenue measures the past. The pipeline measures the future.
How to calculate the 30-day pipeline:
Projected pipeline = Active leads × Average close rate
If you have 20 leads currently in active follow-up and your historical close rate is 25%, your pipeline projects 5 new clients in the next 30 days.
Why it's the most valuable indicator: this month's revenue was decided 4-6 weeks ago, when the leads you eventually closed first came in. If today's pipeline is empty, revenue 6 weeks from now will be low — even if this week looks good.
How to use it in the weekly meeting: at the end of each meeting, answer: how many leads do I currently have in active follow-up? If the answer is less than 2x your monthly new-client target, this week's priority is acquisition — regardless of what else is happening.
Ready to Get More Clients?
At Asio, we teach you to implement these strategies step by step through the Mastery program — combining Meta Ads and conversational automation so you get more appointments and close more sales, without relying on manual messages.